

Energy Insights & Resources
UNDERSTANDING YOUR ENERGY BILL
In most competitive energy markets, your bill includes three primary components: supply, delivery, and taxes and fees.
Supply is the cost of the electricity or natural gas you use. In eligible competitive markets, this is the portion Alignegy can shop among retail energy suppliers to help you secure competitive pricing and contract terms.
Delivery covers the utility’s cost to transport energy to your facility and maintain the local infrastructure. These charges remain with the utility and generally do not change when you select a retail supplier. Your utility also continues to maintain the lines, pipes, meters, and other infrastructure and remains responsible for outages and service emergencies.
Depending on the market and billing arrangement, your supply charges may appear directly on your utility bill, you may receive one consolidated bill from your retail supplier that includes utility delivery charges, or you may receive separate bills from the supplier and the utility.
Sample Bill Source: ComEd.com
ENERGY BY THE NUMBERS
Measurements of Electricity
Electricity Supply Components
Electricity supply costs include more than just the energy itself. Several components work together to make up the total supply price, each influenced by different market and grid conditions. Understanding these components can help explain what drives electricity costs over time.
Measurements of Natural Gas
Natural gas can be measured by volume (the physical amount of gas delivered), or by energy content (the amount of heat that gas can produce). Because the heat content of natural gas can vary, the conversion between volume and energy is not always exact.
Customer bills typically use therms or dekatherms (Dth), while industry and market reports often use larger volume measurements such as Bcf (billion cubic feet) and Tcf (trillion cubic feet).
Measurements of Volume
CCF - Hundred Cubic Feet
Mcf - Thousand Cubic Feet
MMcf - Million Cubic Feet
Bcf - Billion Cubic Feet
Measurements of Energy
Btu - British Thermal Unit
Therm - 100,000 Btu
Dth - Dekatherm = 10 Therms
MMBtu - Million Btu = 1Dth
Natural Gas Supply Components
Natural gas supply costs include more than just the gas itself. Several components work together to make up the total supply price, each influenced by different market, regional, and operational conditions. Understanding these components can help explain what drives natural gas costs over time.
UNDERSTANDING ELECTRICITY MARKETS
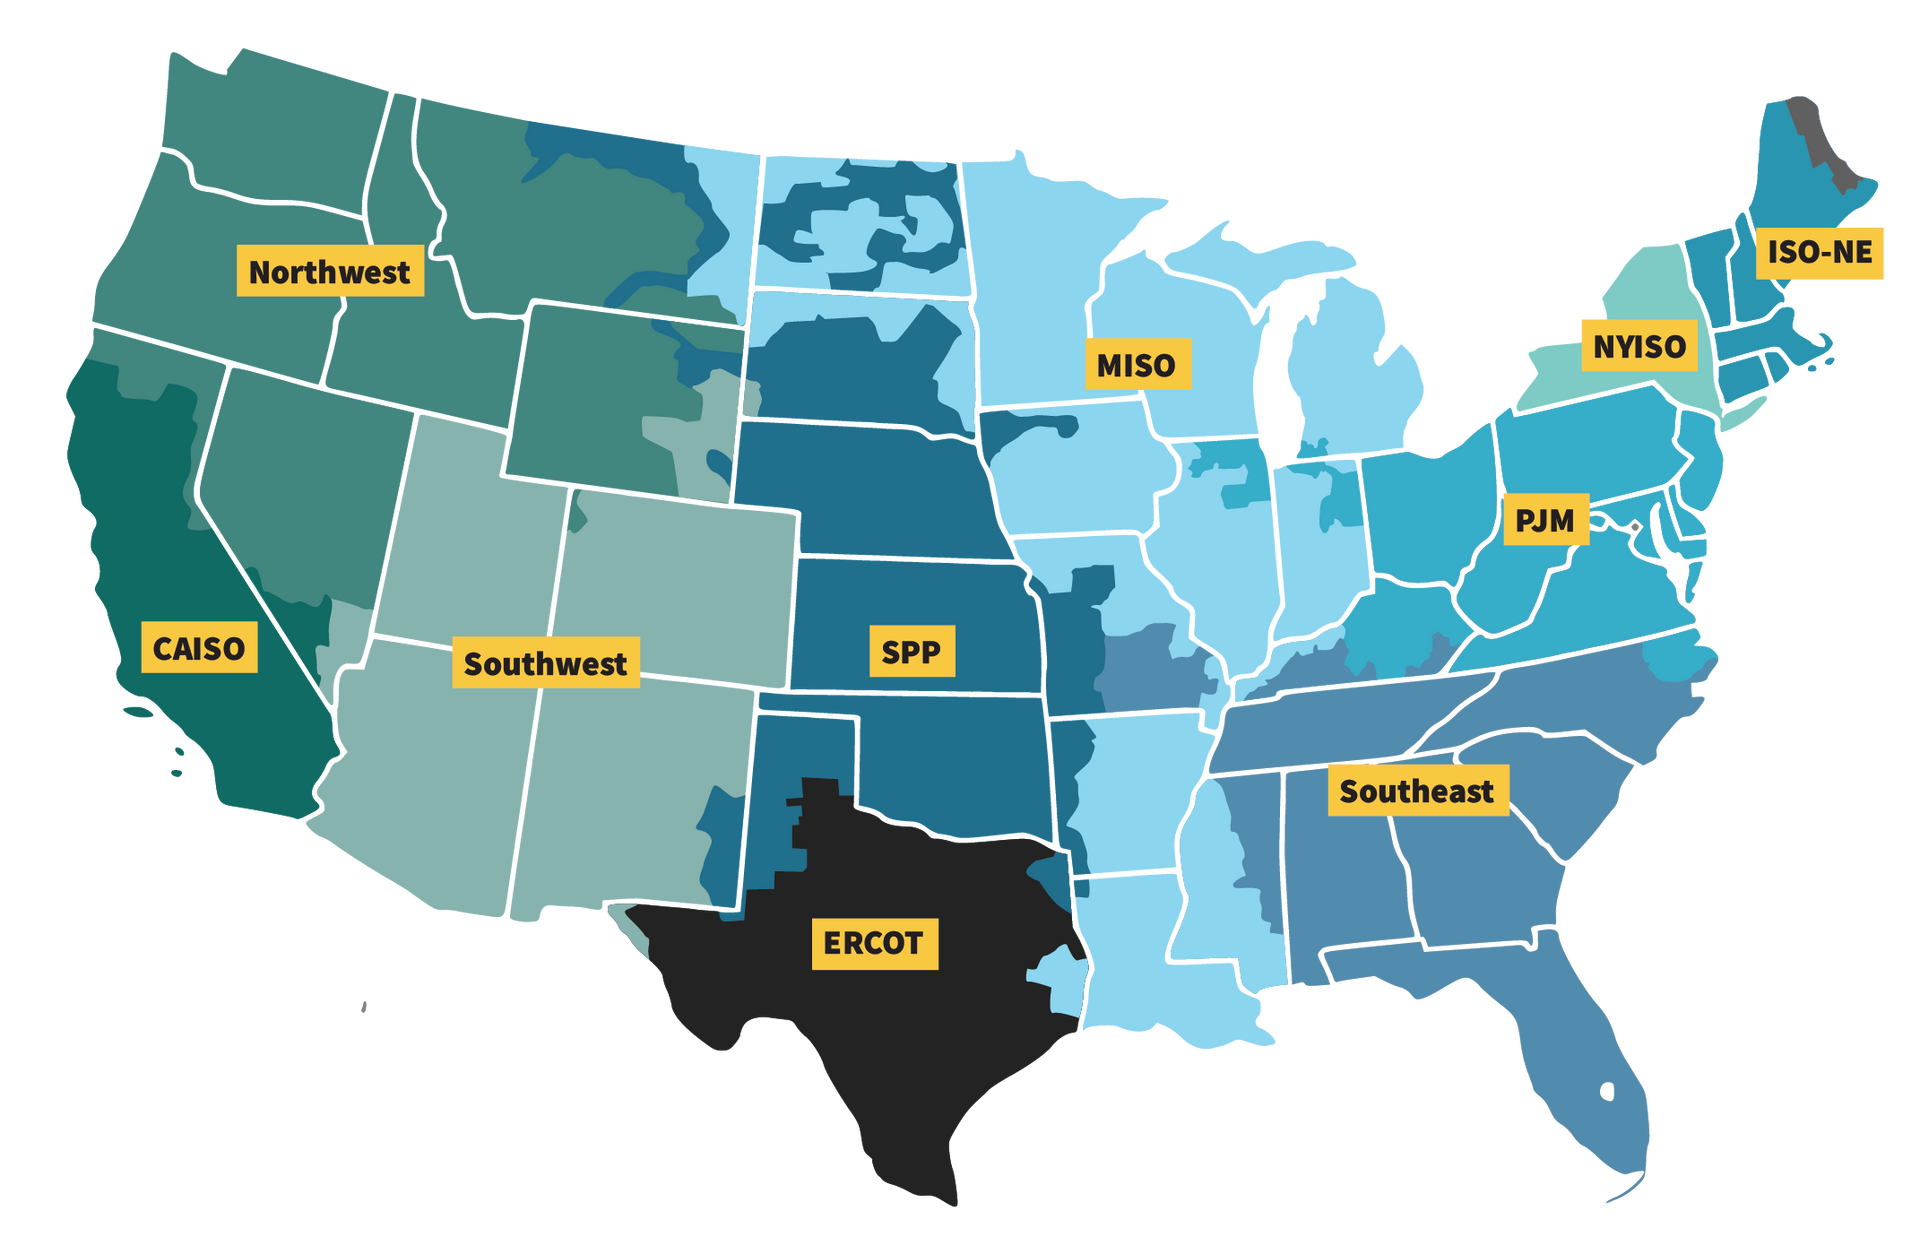
The U.S. electric grid is divided into regional markets, many coordinated by Regional Transmission Organizations (RTOs) and Independent System Operators (ISOs). These independent organizations manage the flow of electricity, balance supply and demand, maintain grid reliability, and operate wholesale electricity markets.
For businesses in competitive electricity markets, the RTO or ISO serving a facility can have a significant impact on cost. Energy, capacity, transmission, congestion, and other market charges are structured differently from region to region—which is why location matters when developing an effective energy procurement strategy.
Competitive Energy Markets
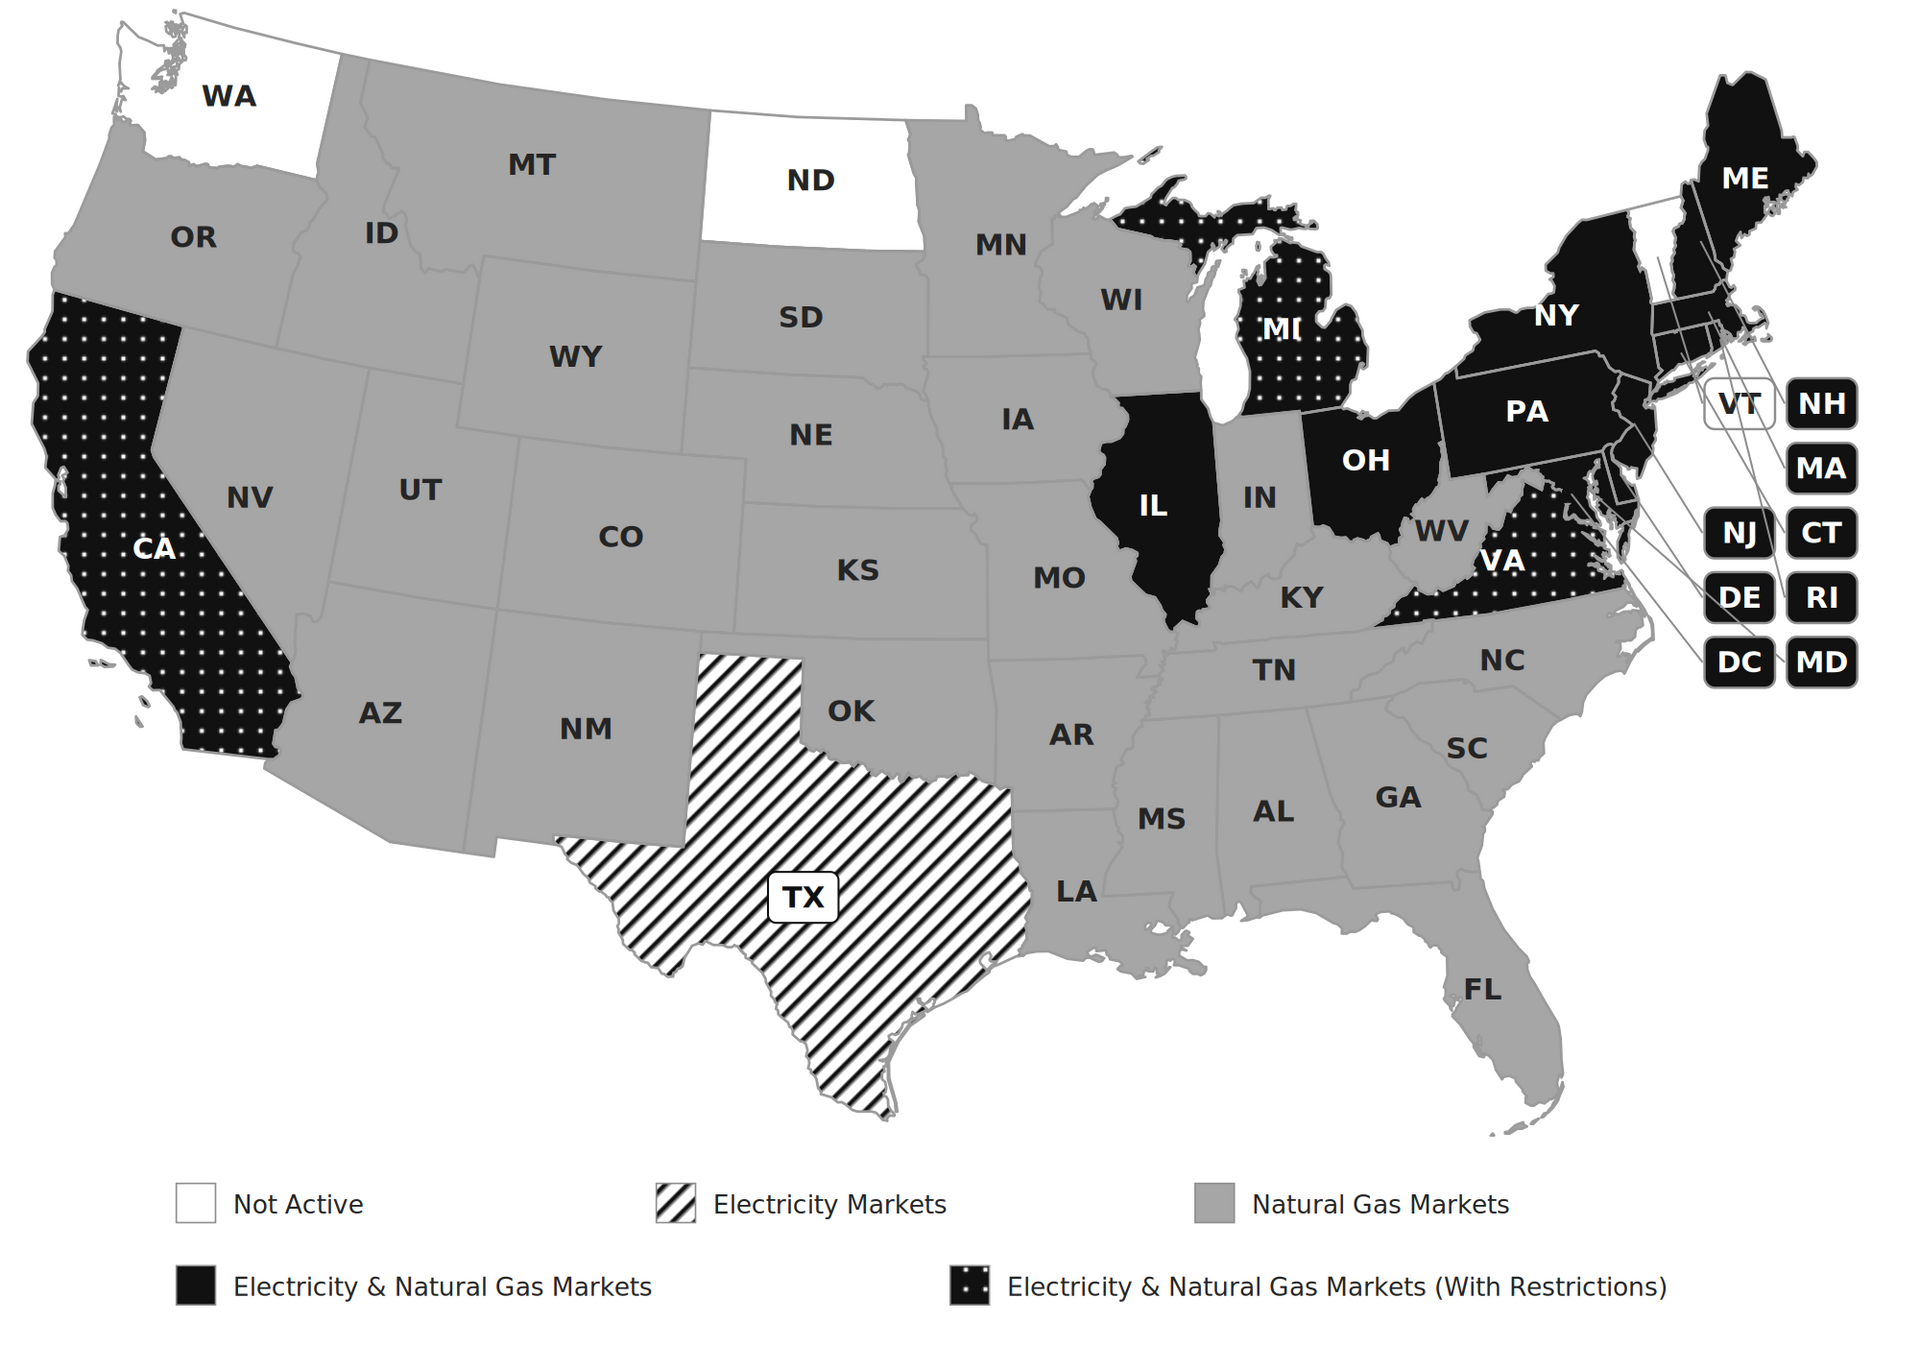
Every business operates in a different regulatory environment. Competitive (sometimes referred to as deregulated) markets open the door to supplier choice and strategic procurement, while regulated markets work differently. Our Competitive Markets map shows, at a glance, which states are open for electricity, natural gas, both, or neither — so you can quickly see where procurement strategy can make the biggest impact across your locations.
How Capacity Works in Competitive Markets
Capacity is one of the most significant—and most regionally variable—components of electricity pricing. Each market takes a different approach to ensuring enough generation is available to meet future demand, which means the way capacity costs are determined and passed through to customers can vary considerably.
List of Services
-
PJM (Mid-Atlantic & Midwest)List Item 1
PJM uses a capacity auction system to forecast and secure resources three years in advance. However, your
company’s individual capacity obligation is set annually based on your five coincident peaks (5 CP). If you're in this region, managing demand during these hours is key to controlling future costs.
-
MISO (Midwest & parts of the South)List Item 2
MISO also operates an annual capacity auction using a more localized planning approach. Reserve margins and capacity costs can vary significantly by zone, with some areas experiencing tighter supply conditions than others. Although capacity charges differ by utility, reducing usage during peak events may help customers limit passthrough costs and other demand-based charges.
-
ISO-NE (New England)List Item 3
ISO-NE runs a Forward Capacity Market, but charges are assessed based on your monthly peak demand, not 5 CP. With limited pipeline infrastructure and high LNG dependency, extreme weather events can still drive up costs— especially for businesses on indexed or pass-through products.
-
NYISO’s (New York State)List Item 4
NYISO capacity market operates similarly to ISO-NE, with prices set monthly and obligations tied to your peak demand. Summer peaks are especially costly in New York City and Long Island, where infrastructure constraints are more acute.
-
ERCOT (Texas)
ERCOT does not have a formal capacity market. Instead, it relies on real-time scarcity pricing to incentivize reliability. That means when demand soars, prices can spike—dramatically. Businesses here don’t pay a separate capacity charge but are exposed to high real-time prices if not locked into a fixed plan.
-
CAISO (California)
CAISO does not operate a centralized capacity market. Instead, California uses a Resource Adequacy (RA) program requiring utilities and other load-serving entities to secure enough capacity to meet projected demand and maintain grid reliability.